Profiling .NET executables
Overview
With NProfiler, you can profile .NET executables from .NET 2 onwards. In the simplest case, all you need to do is specify the path to the .exe file and click Start. Optionally, you can also specify command line arguments, a different working directory, and environment variables.
Step by step
- Start NProfiler. The session configurator opens automatically. Alternatively, click Home → Session → New in the ribbon to open the session configurator.
- Select the application type “Executable File” at the top.
- Configure the desired application options.
- Finally, configure general profiling options in the “Profiling Options” section.
- Click “Start”.
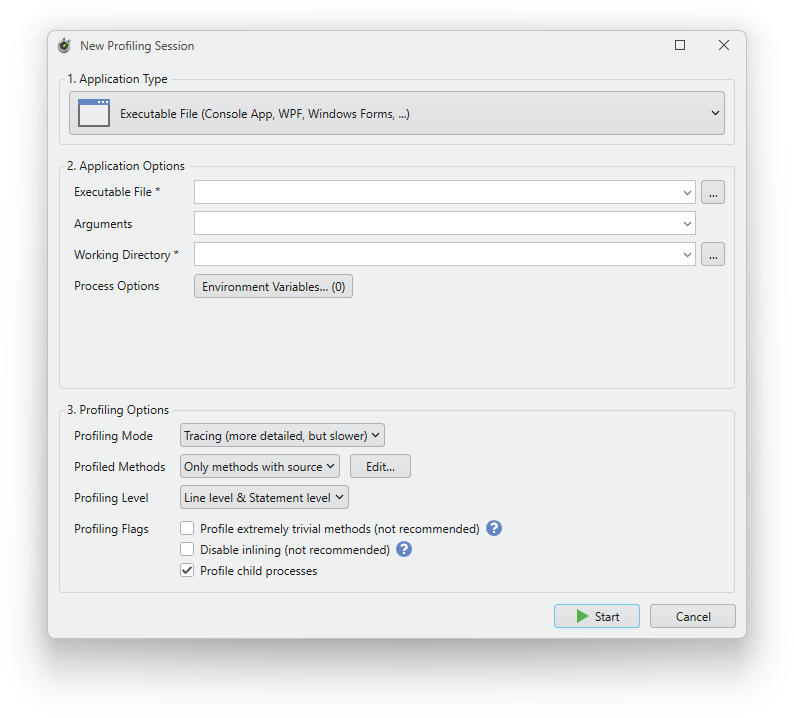
Application options
Executable file
Required. The full path of the executable file to be profiled. Click the “...” button on the right to select a file. You can also select a previously used path from the drop-down list.
Arguments
Optional. Enter command line arguments for the executable file.
Working directory
Required. Enter the working directory for the process. By default, this field is automatically filled with the directory of the executable file.
Environment variables
Optional. Click the “Environment Variables” button to specify environment variables for the profiled process. The number on the button indicates the number of environment variables currently defined.
Remarks
It is not actually correct to say that you can profile .NET executables with this session type. More precisely, you can profile any .exe file that loads a .NET runtime. This means that you can also profile native applications that load a .NET runtime for .NET plugins, or that start .NET child processes. However, only the .NET code is profiled, never the native code.
To initiate profiling, additional profiler environment variables are set for the profiled process at process startup, instructing the .NET runtime to load our profiler DLL into the process.