General profiling options
Overview
The options described in this article are the same for all profiling session types.
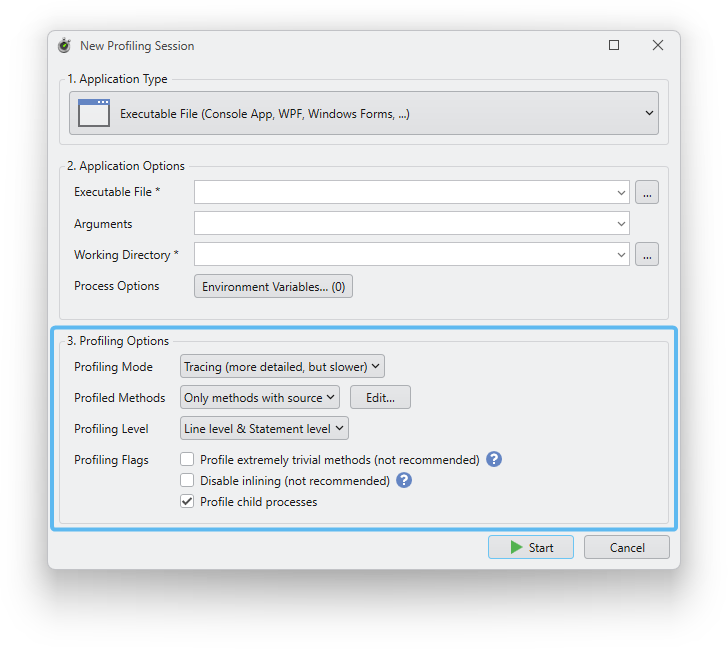
Profiling mode
Determines how profiling results are collected. You can choose between tracing and sampling.
- Tracing is based on actual measurements and is more detailed but slower.
- Sampling is based on statistical estimates from a set of random samples and is less detailed but faster.
The recommended mode is tracing. Attach-to-process sessions only support sampling. Read more in tracing vs. sampling.
Profiled methods
Specifies which .NET methods in your application should be profiled.
If you select “All methods”, every single method will be profiled, including .NET Framework and third-party methods. This option should not normally be used, as it is slow and you are often not interested in performance data for third-party methods.
You can also select “Only methods with source”. This is the default setting and means that only methods from assemblies for which debug symbols (PDB files) have been found will be profiled. Debug symbols are usually only available for your own assemblies, which means that this option restricts profiling to your own assemblies and does not profile framework or third-party assemblies. Note: The correct title for this option would actually be “Only methods with debug symbols”.
If you select “Custom”, a dialog box opens where you can specify the namespaces to be profiled. The same thing happens when you click the “Edit” button. This option is recommended if you already have a rough idea of which part of your application is causing the performance problem. This allows you to profile only the parts of your application that you are really interested in.
We recommend that you profile as few methods as possible. The fewer methods you profile, the faster the profiled application will run and the more compact the database containing the profiling results will be.
Profiling level
Here you can choose whether profiling results should be collected only at the method level or also at the line and statement level.
If you select “Method level”, profiling will be faster, but you will only see performance data at the method level, e.g., how often a method was executed and how much time it took.
If you select “Line level & Statement level”, in addition to the data at the method level, you will also see data on individual lines of code and even on individual statements in a line of code when you move the mouse pointer over the statement in the source code view.
The default setting is “Line level & Statement level”.
Profile extremely trivial methods
Very short methods that do not contain loops are excluded from profiling by default to reduce profiler overhead. Profiling these methods usually does not provide useful data, but you can still profile them if you enable this option.
Disable inlining
The JIT compiler sometimes inserts the code of methods into other methods to save the method call, which leads to higher performance. This is called inlining. Inlining can lead to unexpected profiling results, as some method calls are missing from the call tree. You can use this option to disable inlining.
Profile child processes
This option determines whether child processes started by the profiled process should also be profiled.