Call tree
Overview
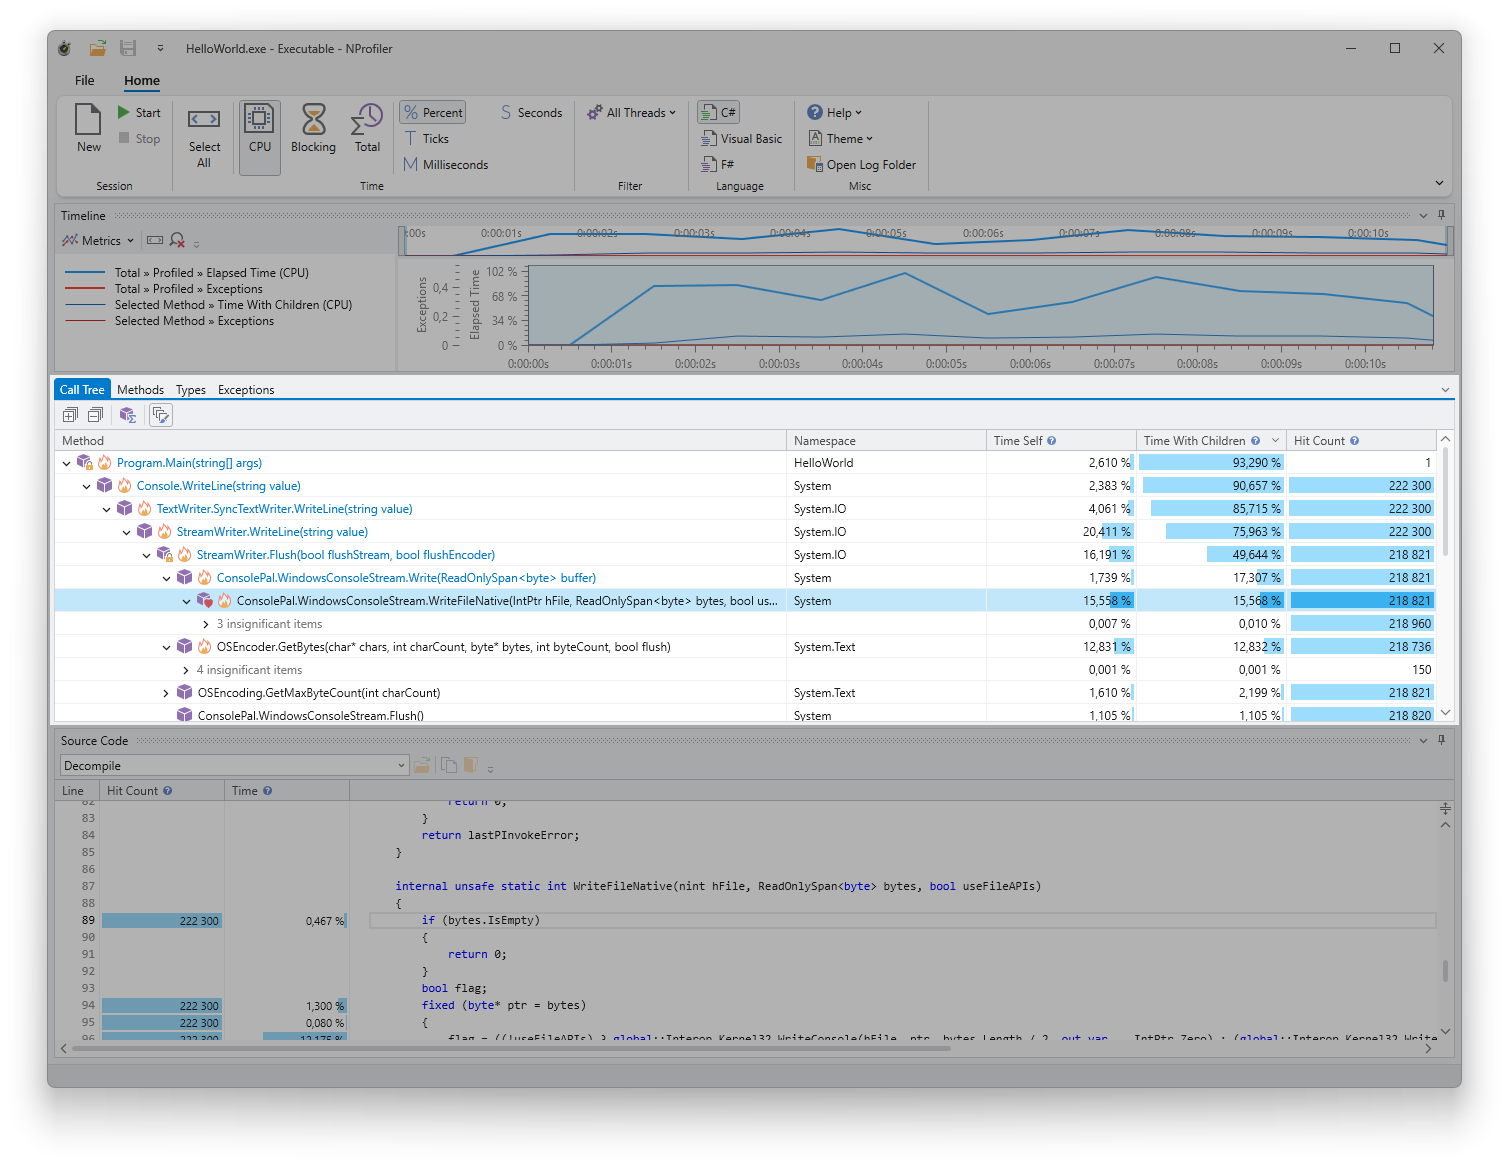
The call tree visualizes the execution paths of the profiled application. It illustrates which methods invoked others, the frequency of these calls, and the total execution time consumed.
Usage
The call tree displays execution paths (stack traces) hierarchically, from the main method down to the deepest nested call. For details regarding column definitions and general usage, please refer to the shared call grid documentation.
Features
- Stack Highlighting: When enabled in the toolbar, selecting a call highlights the entire execution path leading to that method.
- Hot Paths: Execution paths that consume the most time are marked with a flame icon for easy identification.
- Insignificant Items: To reduce visual clutter, calls with negligible time consumption are collapsed into “Insignificant Item” nodes.
Commands
The following commands are available via the context menu or the toolbar:
- Expand Expensive Calls: Automatically expands the call paths that account for the highest time consumption.
- View Subtree Methods: Aggregates the selected subtree into a flat list of methods. This is useful for identifying all methods executed within a specific branch.