Thread selector
Overview
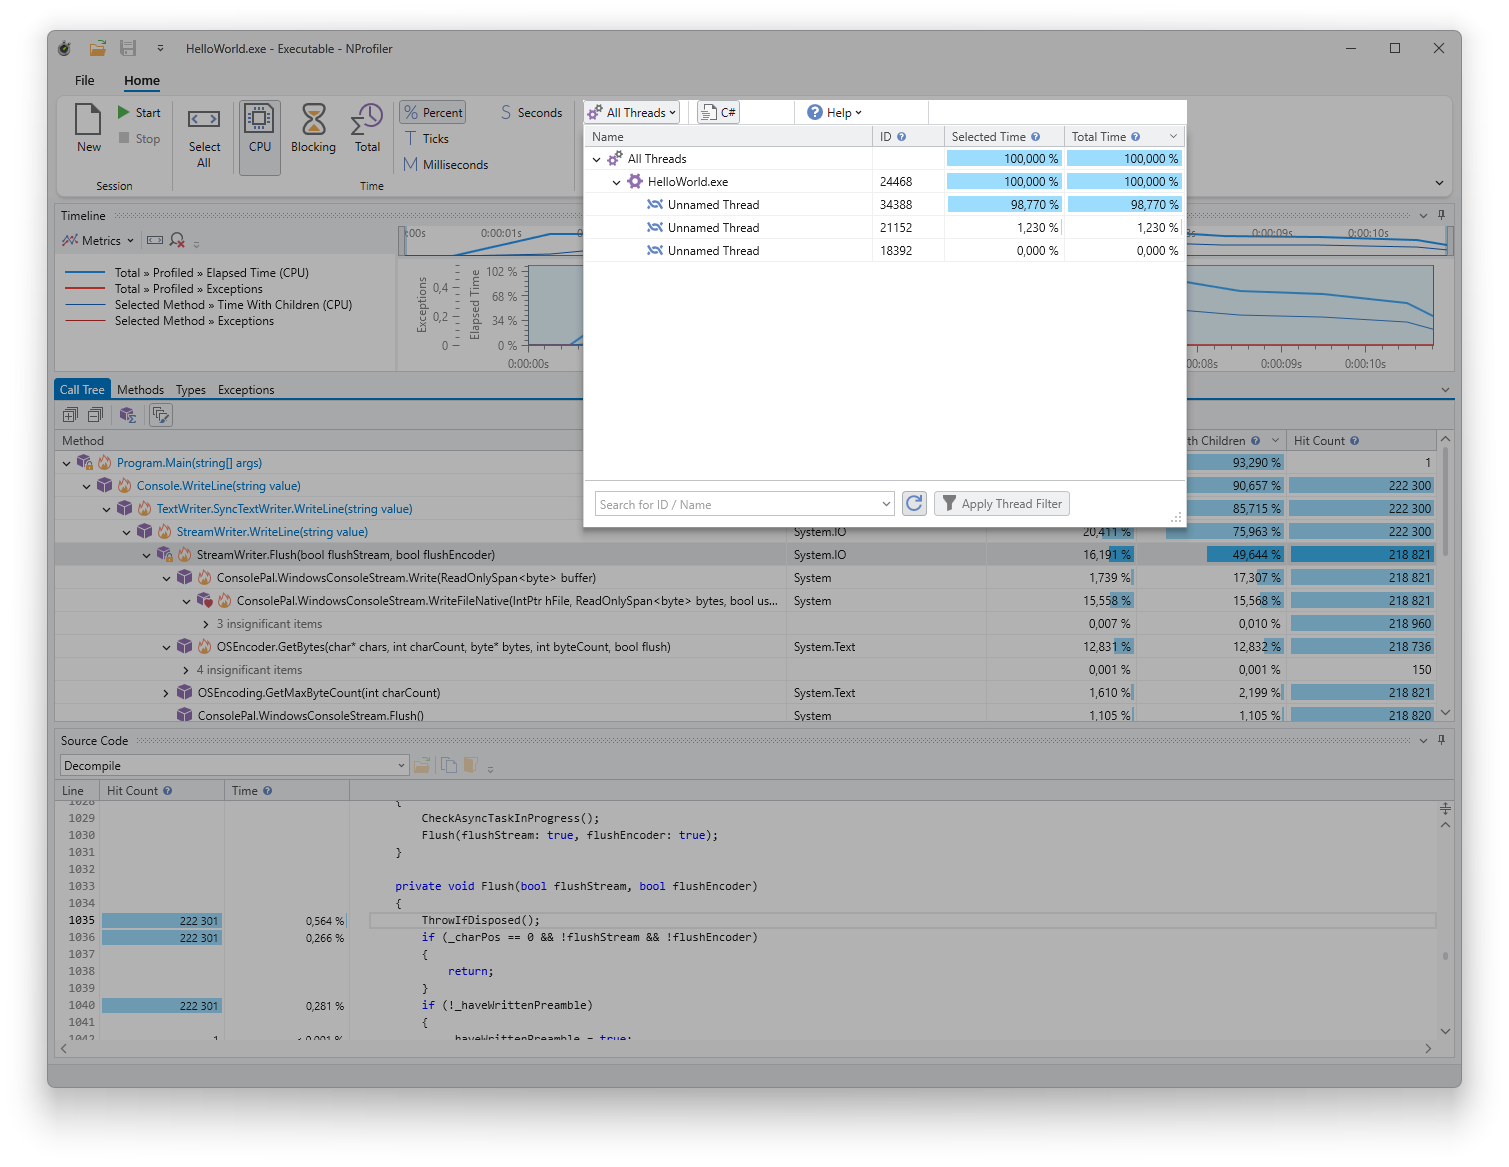
The thread selector displays all profiled processes and threads. It allows you to select specific entries to filter the data in other tool windows down to certain threads.
Columns
- Name: The name of the process or thread.
- ID: The Process ID (PID) or Thread ID (TID).
- Selected Time: The time consumed by the process or thread within the time range currently selected in the timeline.
- Total Time: The total time consumed by the process or thread during the entire profiling session.
You can configure the time metric and display format via the ribbon menu.
Usage
- Sorting: Click a column header to sort the data. Hold the Shift key to perform multi-column sorting.
- Searching: Use the search field at the bottom of the thread selector to find specific processes or threads.
- Filtering: Double-click a process or thread to restrict the data in the other tool windows to that specific entry. Alternatively, you can select multiple processes or threads using Ctrl and Shift and then click the “Apply Thread Filter” button. To reset the filter, double-click the “All Threads” entry.
- Refresh: The Refresh button updates the list of threads, which is particularly useful while a profiling session is still in progress.