Call grid
Overview
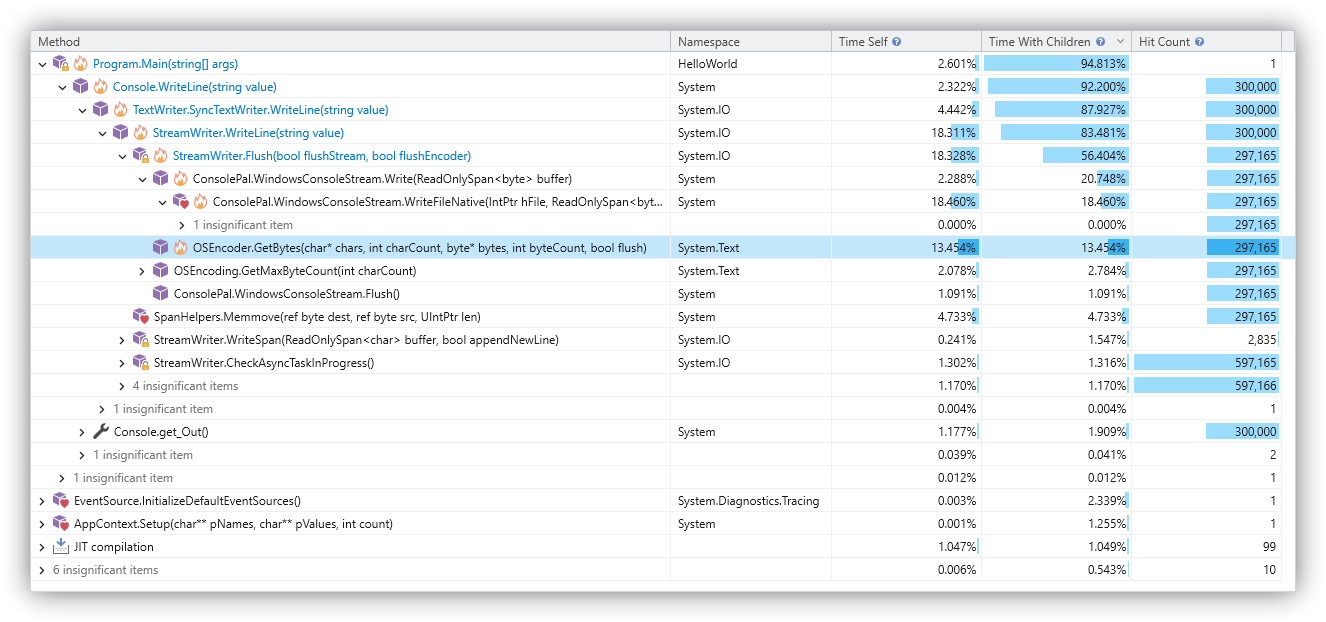
The call grid control is utilized by several tool windows. It displays method calls and operations such as JIT compilation or module loading, along with their respective execution times and call frequencies.
Columns
- Method: Typically the called method and its type. It may also represent other operations like JIT compilation or module loading.
- Namespace: The namespace of the type associated with the called method.
- Time Self: Execution time spent within the method itself (excluding child calls).
- Time With Children: Total execution time spent within the method, including all child calls.
- Hit Count: The number of times the method was called.
Usage
- Sorting: Click a column header to sort the data. Hold the Shift key to perform multi-column sorting.
- Filtering: Select a time range in the timeline to filter the data by time, or use the thread selector to limit the data to specific threads.
- Customization: Use the ribbon to switch the programming language for method signatures, as well as the time metrics and formatting.
Commands
The following commands are available via the context menu or, in some cases, the toolbar:
- Find All Calls: Locates all occurrences of the item within the call tree and displays them in a call context list.
- View Exceptions: Displays all exceptions thrown by the selected item in a new exception list. This option is only available if exceptions were actually recorded for that item.
- Collapse All: Collapses all nodes within the entire grid.
- Collapse Others: Collapses all nodes in the grid except for the path leading to the currently selected item.
- Collapse Descendants: Collapses all descendant nodes of the selected item.
- Collapse Siblings: Collapses all sibling nodes of the selected item.