Ribbon
Overview
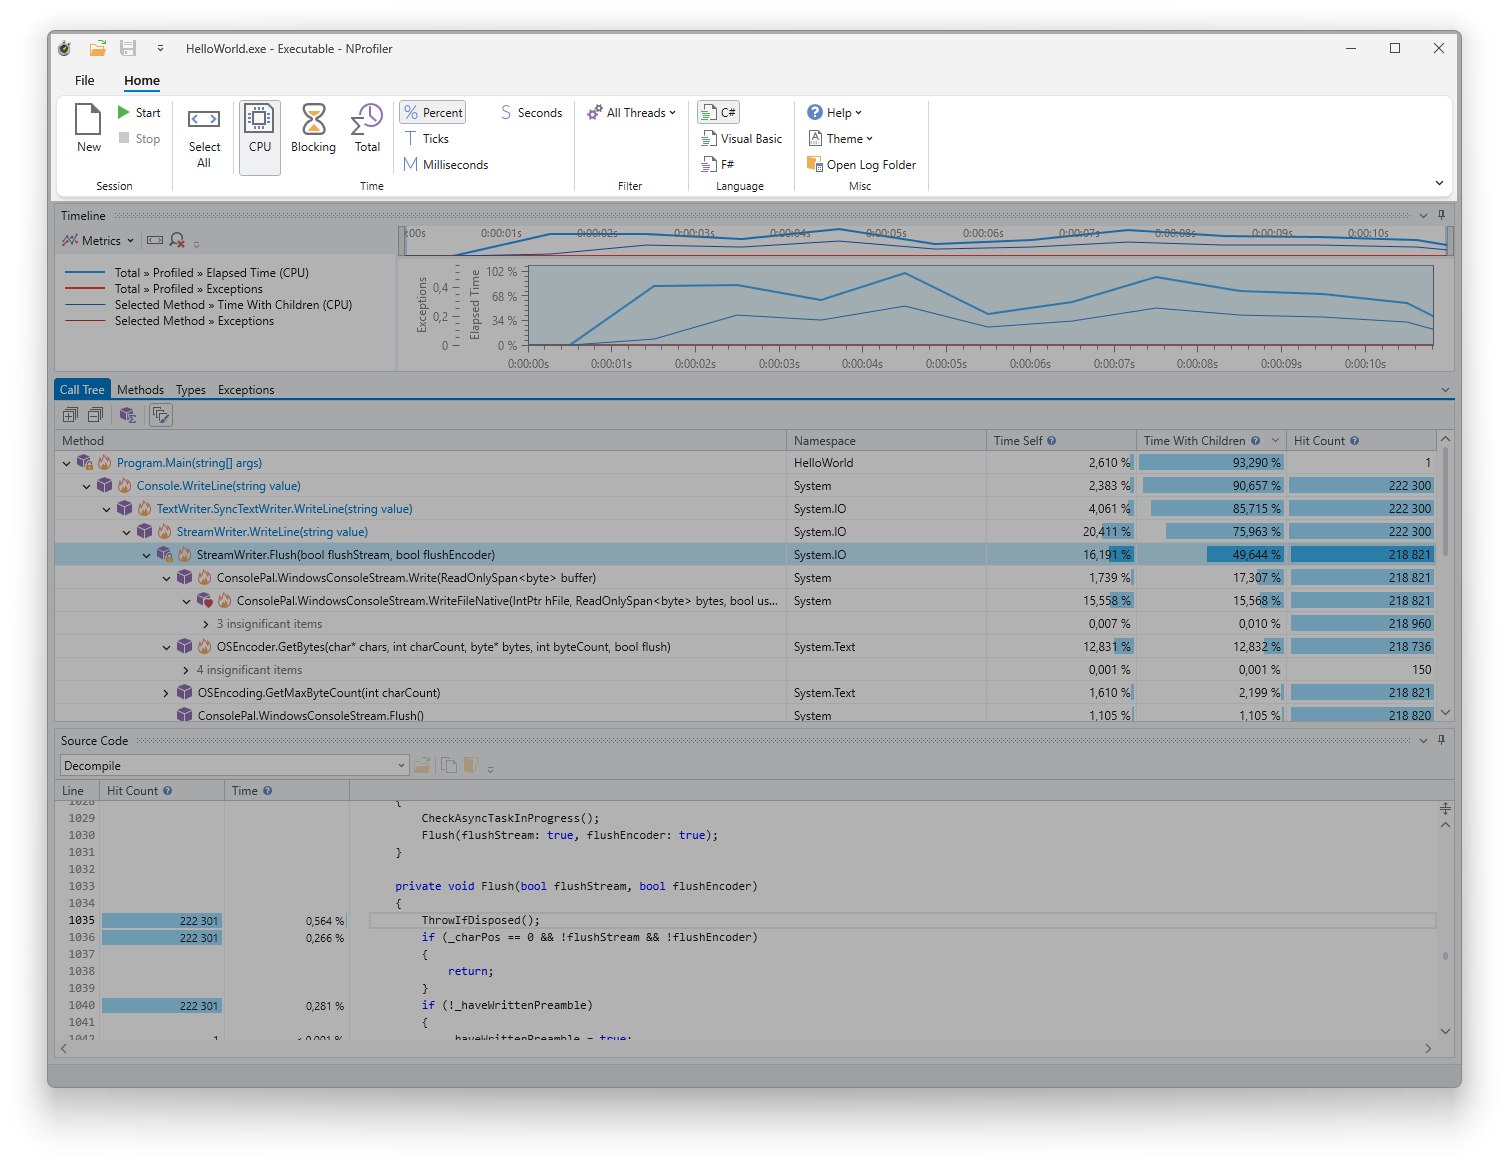
The ribbon is the central control interface of NProfiler.
Commands
File
- New: Opens the session configurator to set up and start a new profiling session.
- Open: Opens a previously saved profiling results file.
- Save / Save As: Saves the current profiling data to a file or under a new filename.
- Close: Closes the current profiling session.
- Exit: Closes NProfiler.
Session
- New: Opens the session configurator to set up and start a new profiling session.
- Start: Restarts the current profiling session using the existing settings, bypassing the configurator.
- Stop: Ends the active profiling session.
Time
- Select All: Selects the entire recorded time range in the timeline.
- CPU / Blocking / Total: Sets the time metric to be displayed in the tool windows.
- Units (%, Ticks, ms, s): Defines the format for time values. Note: One second equals 1010 (ten billion) ticks.
Filter
- All Threads: Opens the thread selector to filter data in tool windows. The button's appearance reflects the current thread selection (defaults to all threads).
Language
- C# / Visual Basic / F#: Sets the programming language for method and type signatures in the tool windows. Note: This does not change the decompilation language in the source code view, which is currently limited to C#.
Misc
- Help
- Contact Support: Access the support website.
- Activate License: Enter your license key to activate the software.
- About NProfiler: View version details in the “About” dialog.
- Theme: Toggle between Light and Dark mode.
- Open Log Folder: Opens the directory containing NProfiler's log files.
Customization
Click the small icon in the bottom-right corner of the ribbon to access the Ribbon Display Options:
- Layout: Switch between Classic Layout (standard) and Simplified Layout (a compact, traditional toolbar style).
- Visibility: Toggle between “Always Show Ribbon” and “Show Tabs Only” to save vertical screen space.
- Quick Access Toolbar: Customize the toolbar in the window's title bar. You can add or remove any ribbon button by right-clicking it.