Stop Chasing False Bottlenecks.
The Ultra-Accurate .NET Performance Profiler.
Get precision timings free from profiler overhead, wrapped in a clean, zero-bloat UI.
Free for non-commercial use
Deep Performance Insights. Zero Configuration Required.
The Sound of Silence
Engineered for Overhead Compensation.
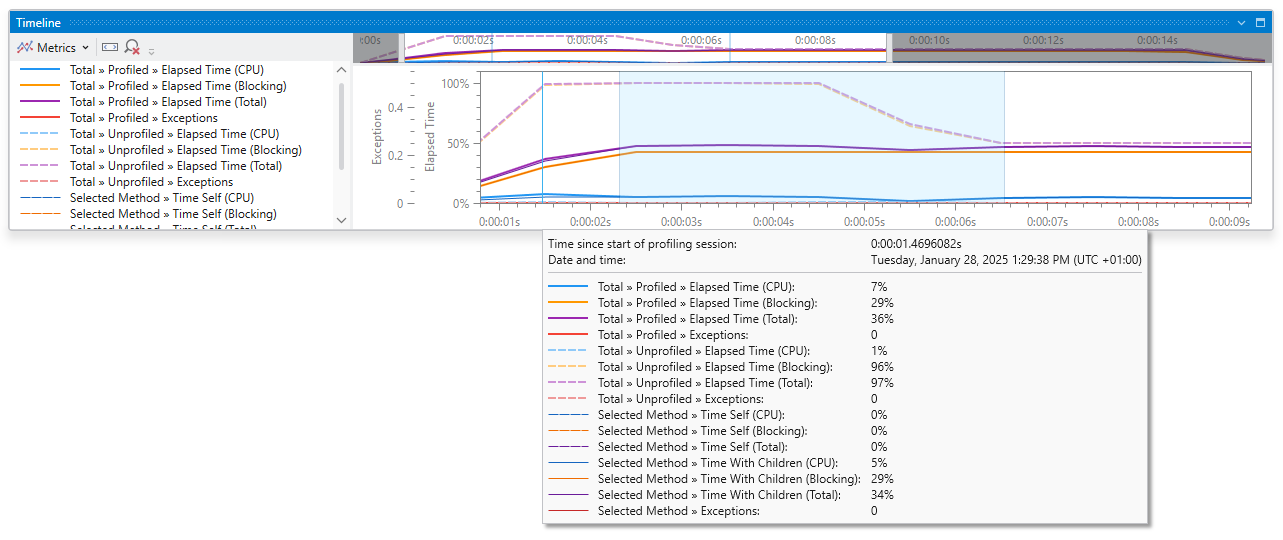
Most .NET profilers distort their own measurements by ignoring the resource overhead they create. They show you bottlenecks that don't exist in reality. NProfiler is engineered from the ground up to mathematically subtract profiler overhead, delivering the closest thing to true production telemetry.
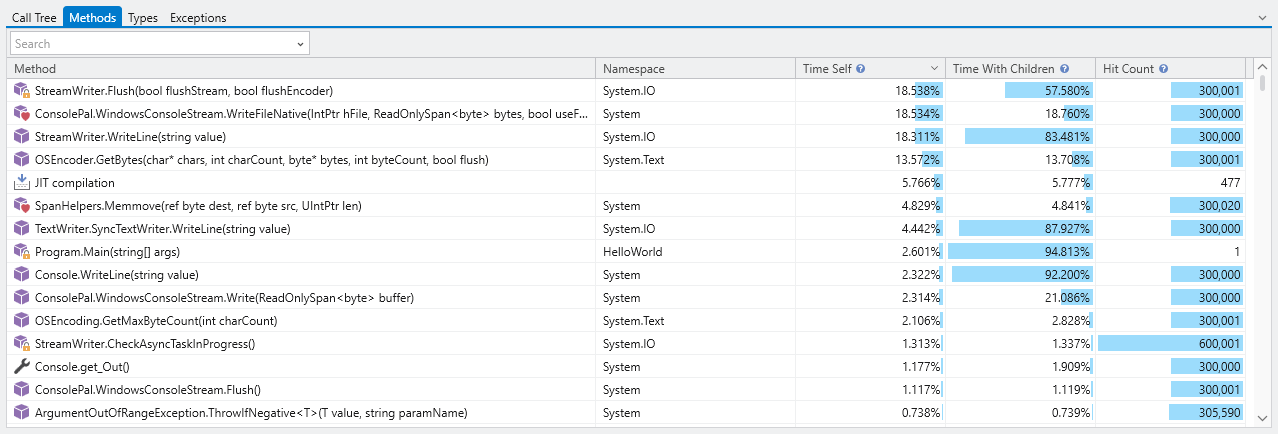
- Eliminate "False Bottlenecks": Stop wasting hours optimizing code that isn't actually slow. NProfiler cleans up the noise so you only fix what’s broken.
- Unmatched Data Fidelity: On average, NProfiler delivers significantly higher timing accuracy than standard competing tools.
- Production-Grade Insights: Observe your application’s behavior exactly as it would run under real-world server loads—completely free from profiler-induced lag.
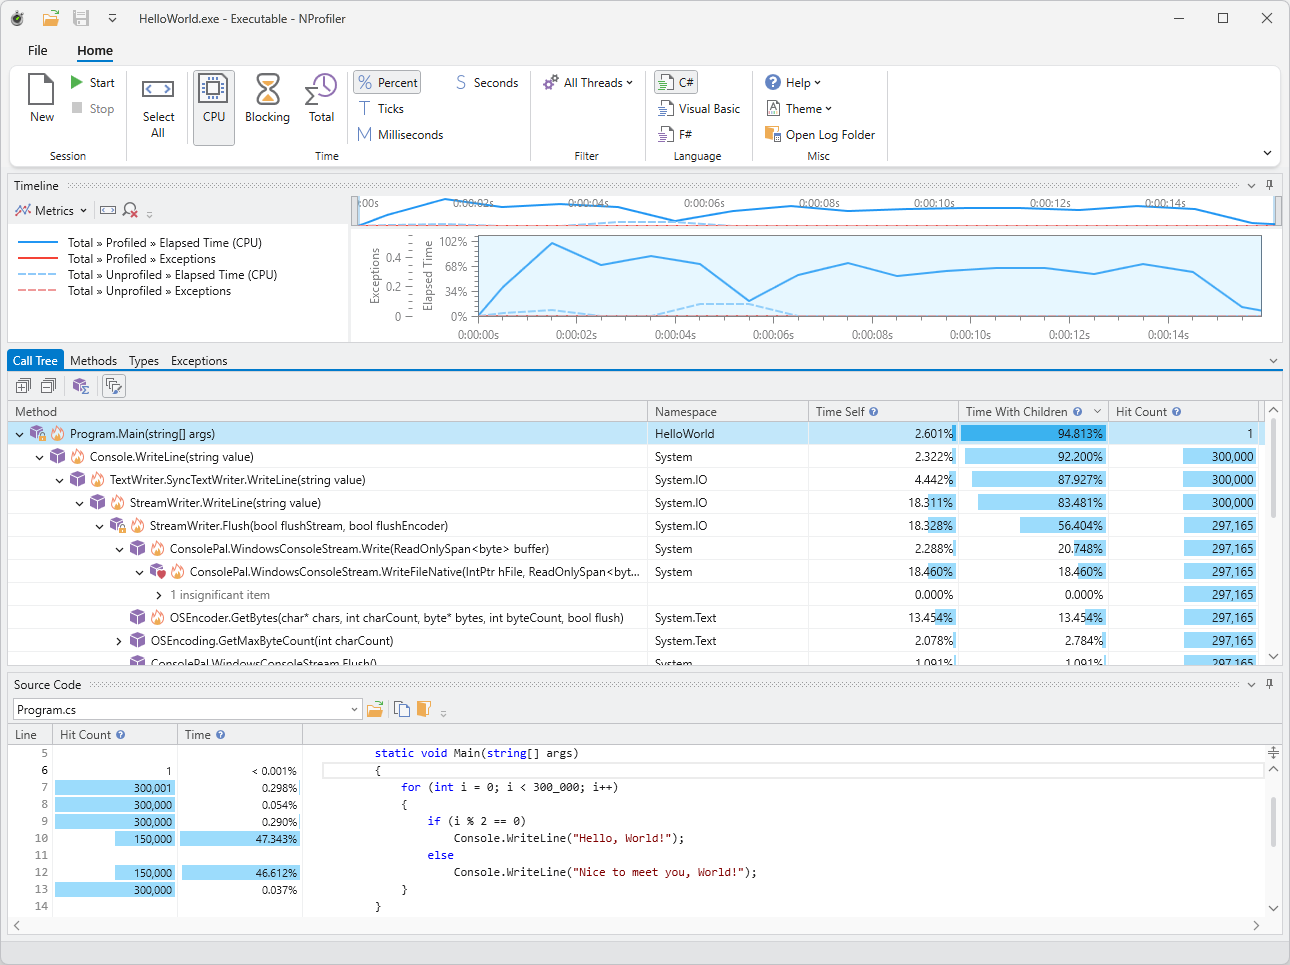
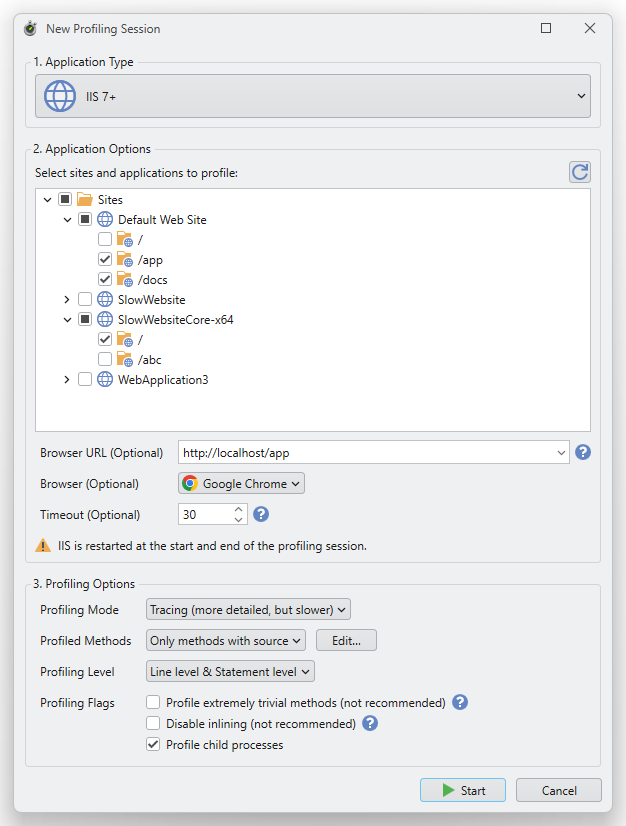
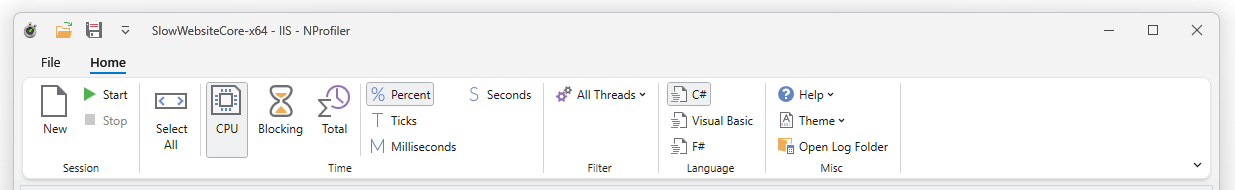
Profile Any .NET Application
From desktop executables and ASP.NET Core web apps to Windows Services and IIS/IIS Express. Seamlessly attach to any running .NET process in seconds.
Any Framework, Any .NET Language
Full support for C#, VB.NET, and F#. Profile everything from legacy .NET Framework 2.0+ apps up to modern .NET Core, .NET 5+, and .NET Standard.
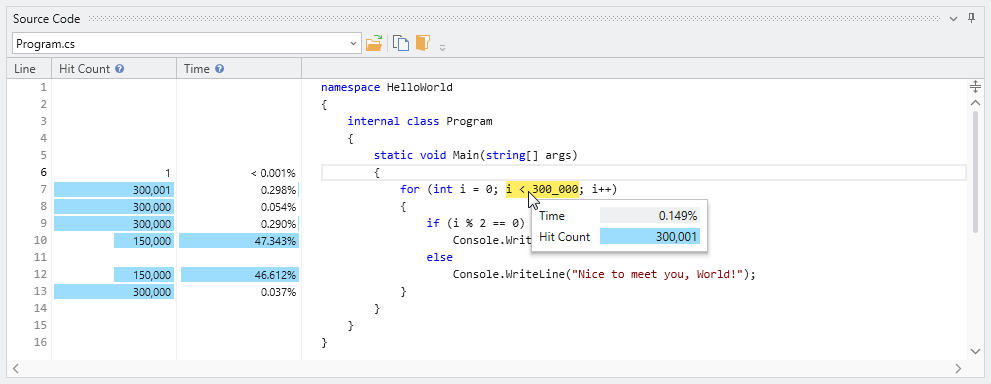
Integrated Decompilation
No source code? No PDBs? No problem. NProfiler decompiles third-party components and legacy assemblies on the fly, delivering full line-level timings anyway.
Hardened for Complex Edge Cases
Built to survive where others crash. NProfiler handles complex multi-threaded interleaving, high-frequency JIT loops, and deeply nested generic calls without breaking a sweat.
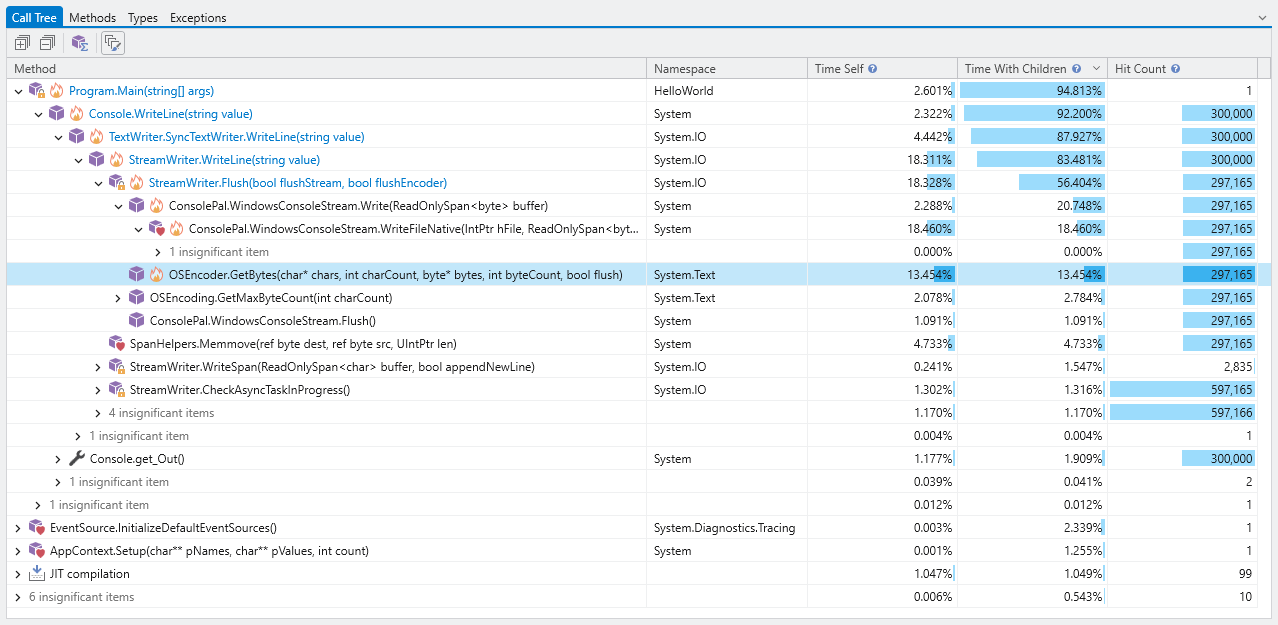
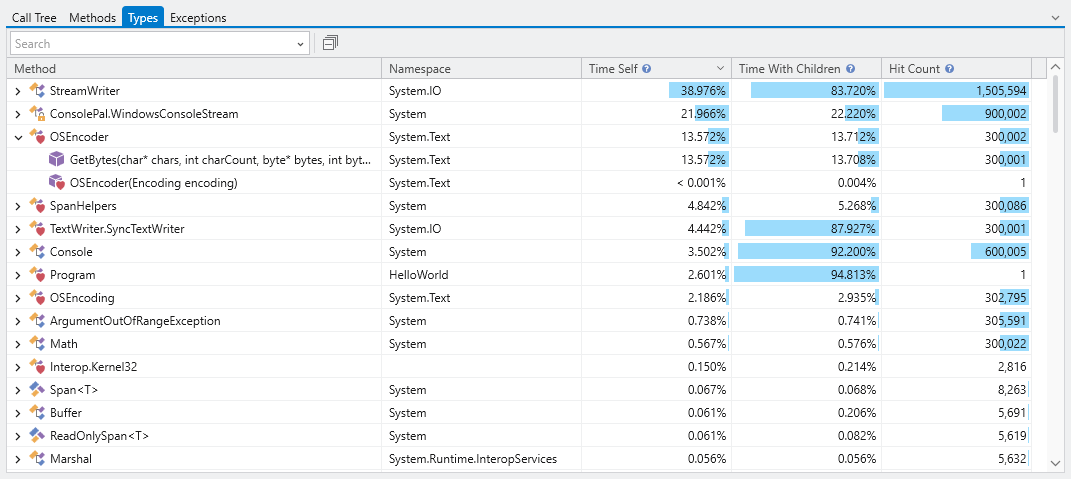
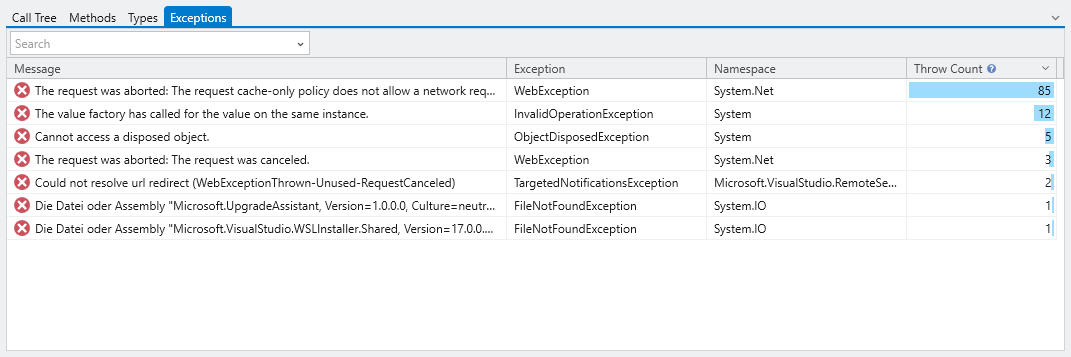
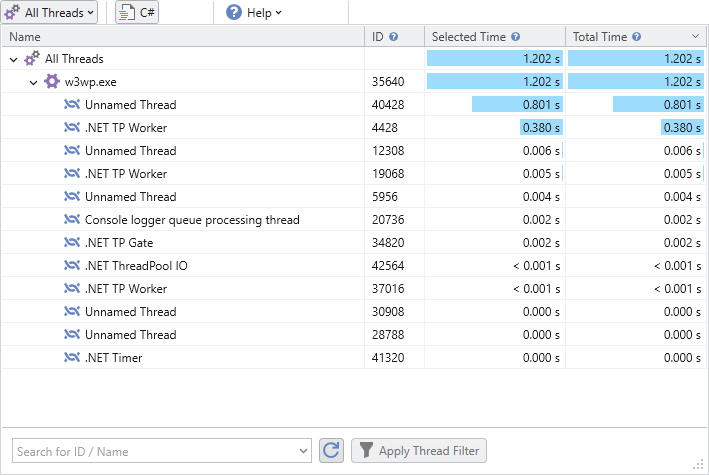
Everything You Need to Solve the Hardest Performance Riddles.
Got Questions? We Have Answers.
No fluff, no marketing speak. Here are the technical details and answers to the most common questions .NET engineers ask about NProfiler.
No. NProfiler operates 100% locally on your machine. Your profiling data, source code snapshots, and decompiled assemblies never leave your computer.
NProfiler leverages the official .NET Profiling API. It runs as an isolated diagnostic tool, meaning you don't need to change a single line of code, modify your csproj, or install additional NuGet packages.
While NProfiler's overhead compensation ensures highly accurate data, any profiler introduces some CPU overhead during active measurement. We recommend using it in development, staging, or controlled testing environments rather than high-traffic live production.
NProfiler is fully optimized for Windows (Windows 10/11) and Windows Server. It allows you to profile desktop apps, services, and IIS web applications locally.
Absolutely. If you start using NProfiler for commercial or company projects, you can easily purchase a commercial license on our pricing page and swap the license key inside the app without losing your data.
NProfiler includes tailored profiling engines for both runtimes. It automatically detects whether your target application runs on the classic .NET Framework or the modern .NET Core CLR, activating the correct diagnostic pipelines under the hood.
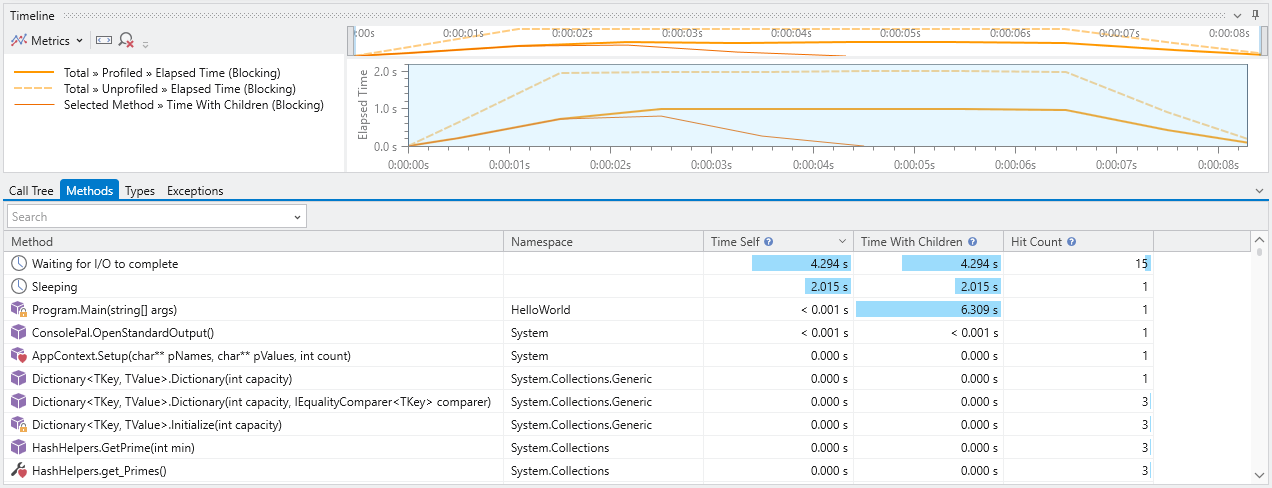
NProfiler is heavily optimized for execution timings, CPU usage, wall-time bottlenecks, and thread synchronization. While it tracks runtime events, it focuses on making your code faster, rather than deep memory-heap/allocation snapshots.
Stop Guessing. Start Measuring With Absolute Precision.
Download NProfilerFree for non-commercial use