Source code
Overview
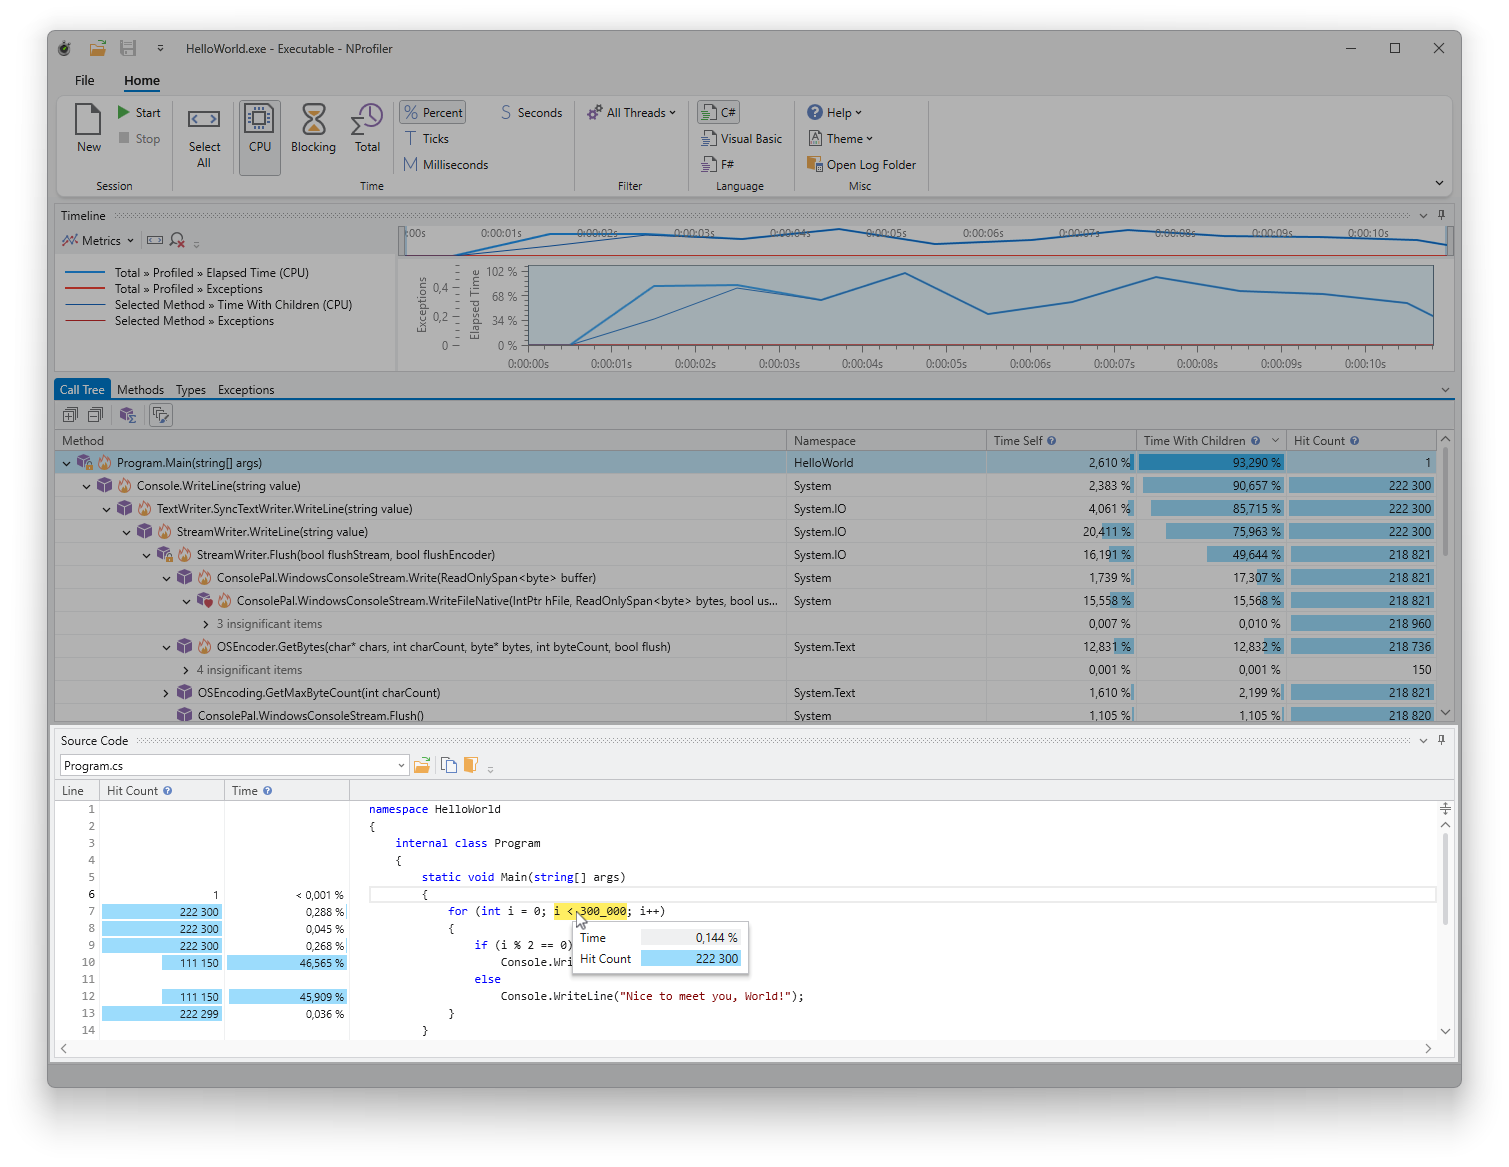
The source code view displays the source code of the selected method, including execution times and hit counts at both the line and statement levels.
Usage
When you select a method in any other tool window, its source code is automatically loaded into the view. On the left, three columns display the line number, the hit count (how often the line was executed), and the total time consumed by that line.
By hovering over individual expressions within the code editor, a tooltip appears showing the specific execution time and hit count for that statement.
Handling lambda expressions
Sometimes a single line of code contains logic from multiple methods, such as when using lambda expressions. In this case, the time value displayed at the line level represents only the longest execution time of that line across all methods, indicated by a small info icon. This is an optimization; a perfectly precise calculation for every scenario would significantly slow down profiling and bloat the collected data. In such cases, hover over individual expressions to view exact timings.
Navigation and editor features
- Highlighting: The first line of the selected method is highlighted with a light gray border.
- Search: Click inside the editor and press Ctrl+F to search within the source code.
- Split view: Use the icon at the top of the vertical scrollbar to split the editor into two panes, allowing you to view different parts of the file simultaneously.
- File selection: A dropdown list in the toolbar displays the current file name. You can switch between files here if a method is split across multiple sources (e.g., constructors with member initializations in partial classes).
- Decompilation: You can select the “Decompile” option in the file dropdown to show decompiled code instead of the original source. Decompilation is triggered automatically if the source code cannot be found or if it no longer matches the profiled version due to changes. In the latter case, the original file remains in the list but is marked with a warning icon.
Filtering data
Select a time range in the timeline or specific threads in the thread selector to limit the displayed performance data. You can also adjust the time metrics and formatting in the ribbon.
Commands
The following commands are available via the toolbar:
- Open File: Manually open the correct source file if it was not found. NProfiler will remember your selection and attempt to resolve other files relative to this path in the future.
- Copy Full Path: Copies the full source file path to the clipboard.
- Open Containing Folder: Opens the file's location in Windows Explorer.