Timeline
Overview
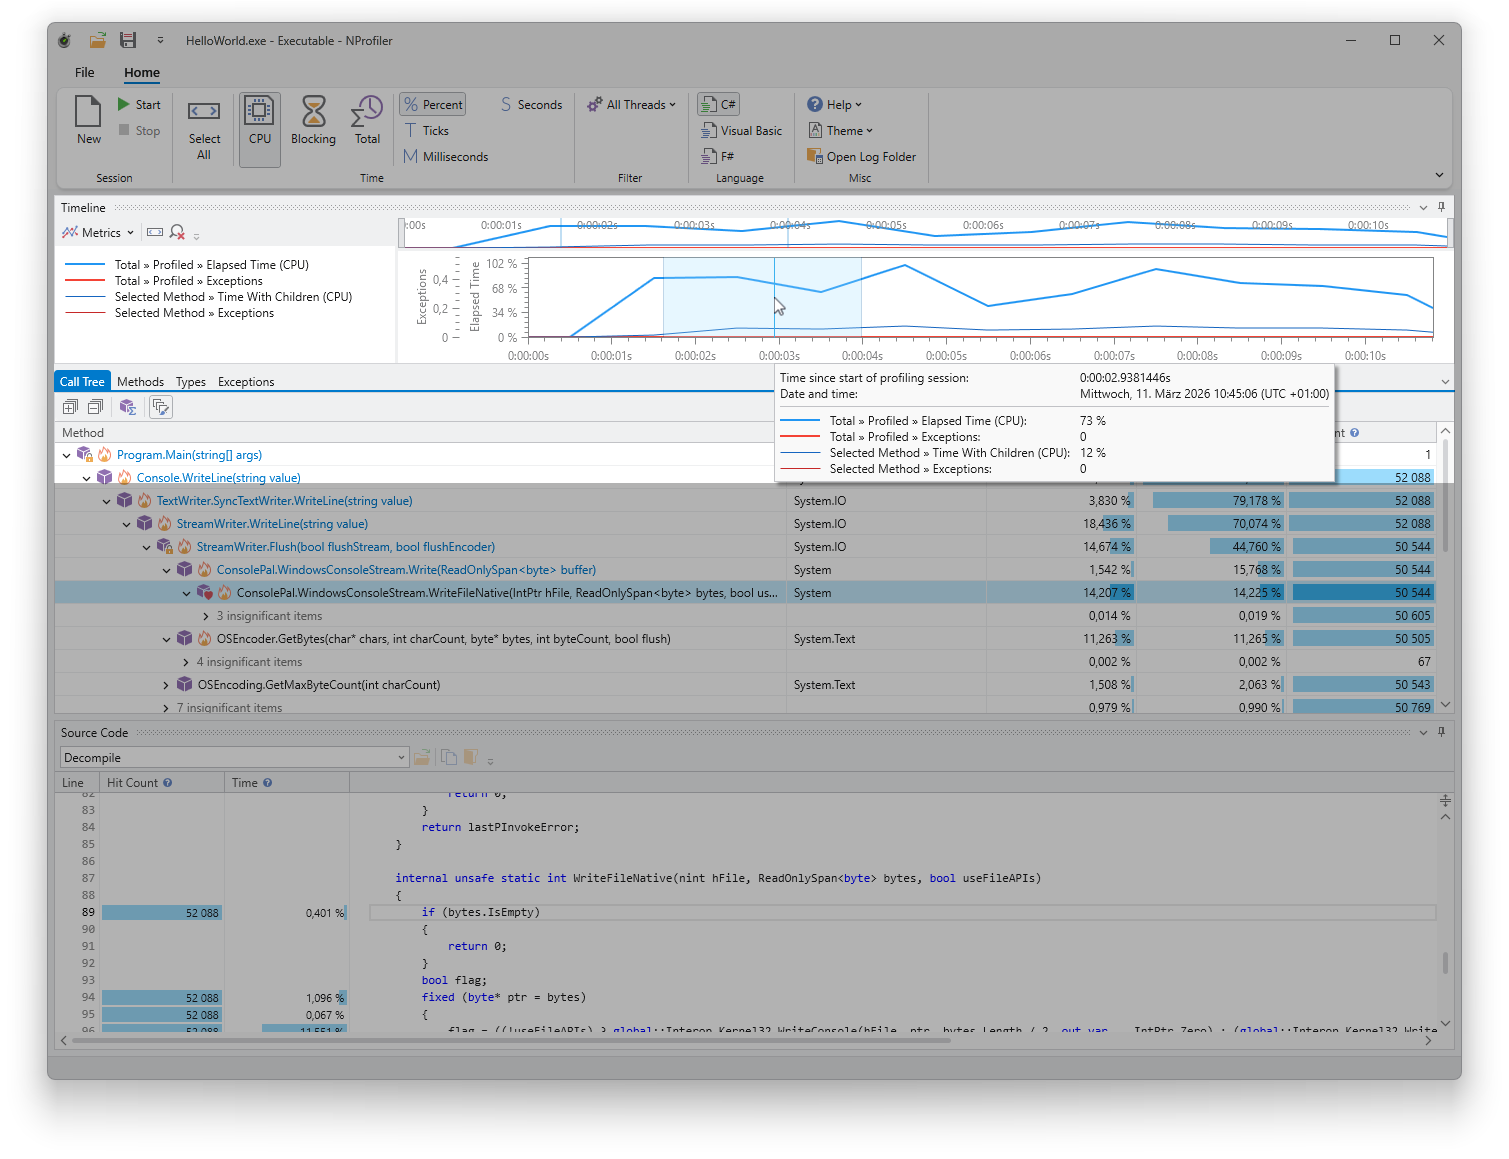
The timeline displays the chronological progression of the profiling session. You can toggle various metrics, zoom in, and select a specific time range to filter the data shown in the other tool windows.
Metrics
The timeline supports various metrics which can be toggled via the “Metrics” button in the toolbar. These include execution times and exception counts at both the session and method levels, covering both profiled and unprofiled code. For detailed definitions of each metric, hover over the entries within the Metrics menu to display informative tooltips.
Displaying metrics for unprofiled code is particularly valuable; it helps identify periods where significant time was spent in excluded methods, suggesting they may need to be included in your next profiling run.
Legend
A legend to the left of the timeline charts identifies which metric each line represents.
Overview chart
The overview chart is located above the main chart and provides a persistent overview of the entire session. By using the mouse wheel or dragging the handles on the left and right, you can zoom the main chart into a specific time range.
Main chart
The main chart displays the currently focused time range of your session.
Selection and filtering
- Select a range: Click and drag to highlight a specific time period. This automatically filters the data in all other tool windows to match the selected range.
- Reset selection: To view the entire session again, click “Select All” in either the timeline toolbar or the ribbon.
- Live analysis: You can select time ranges while a profiling session is still active to analyze results without needing to stop the recording.
Navigation and interaction
- Zooming: Use the mouse wheel to zoom in or out. You can quickly return to the default view by clicking the “Reset Zoom” button in the timeline toolbar.
- Tooltip: Hover your cursor over the chart to view a tooltip containing detailed data for that specific point in time.